US indices climb from one high to another, while the risk sentiment remains strong. The demand of the US- dollar shows mixed sentiment with signs of a potential increase in value. Gold prices have been under pressure in the past three months and the crypto market keeps lagging behind, as well. Fading prices might hence be expected given the candlestick pattern last month.
The demand in crypto ETFs has been mixed, which contributes to the point that large- cap tokens fell between 2% to 6%. XRP ETFs accumulated about USD 35 million between May 20 – 29 while BTC and ETH lost about USD 2 billion combined. Given the bearish technical patterns, the outlook for the month of June also remains rough. Should stock markets face some profit taking, that might also contribute to a further decline in the crypto market. Investors in the crypto market, who think long- term, celebrate the decline in prices as add to their positions at a lower cost.
Technical analysis:
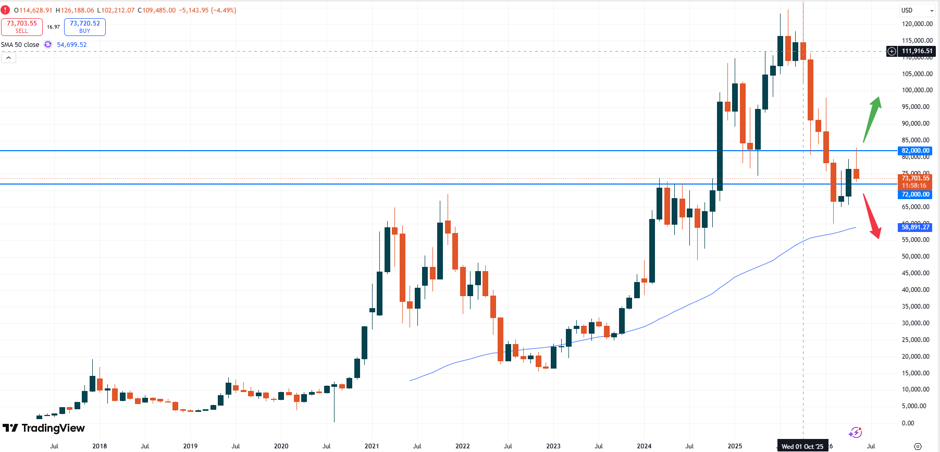
– BTC: Bitcoin is trading at USD 73,703. After the rise of the token during the first week of May the market started to decline. In the end BTC closed negative and finished trading last month with a bearish candlestick pattern.
BTCUSD, monthly chart
The bearish pinbar candlestick pattern shows, that the market might now start to turn lower. Since Bitcoin has not been able to break above the recent resistance level of USD 82,000 traders should now prepare for further negative market momentum. Especially a break below the USD 72,000 handle might indicate pressure towards the 50- moving average zone at around USD 59,000.
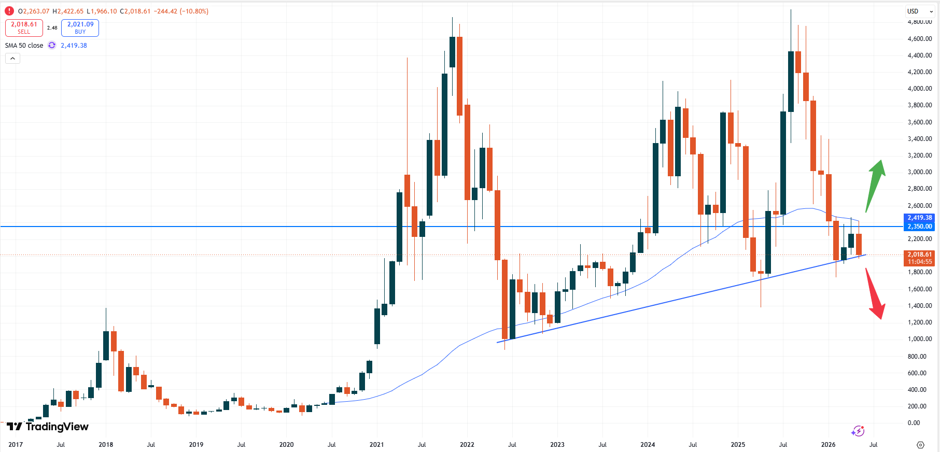
– ETH: Ethereum is currently trading at USD 2,018. Similar to Bitcoin also the price of Ethereum has lost sharp momentum. After the price initially developed positive momentum at the beginning of May the price declined towards the end of last month.
ETHUSD, monthly chart
The monthly charting pattern above shows that the price is currently testing the rising trendline, which can be seen in blue colour in the chart above. A break below might also signal trouble, which could push ETH lower. The acting resistance level of USD 2,419, which is marked as well in form of the 50- moving average, might act as strong resistance. Only a break above that range indicates that new bullish market sentiment will return. However, since this trendline supported the market for several years, a break might also not be likely.
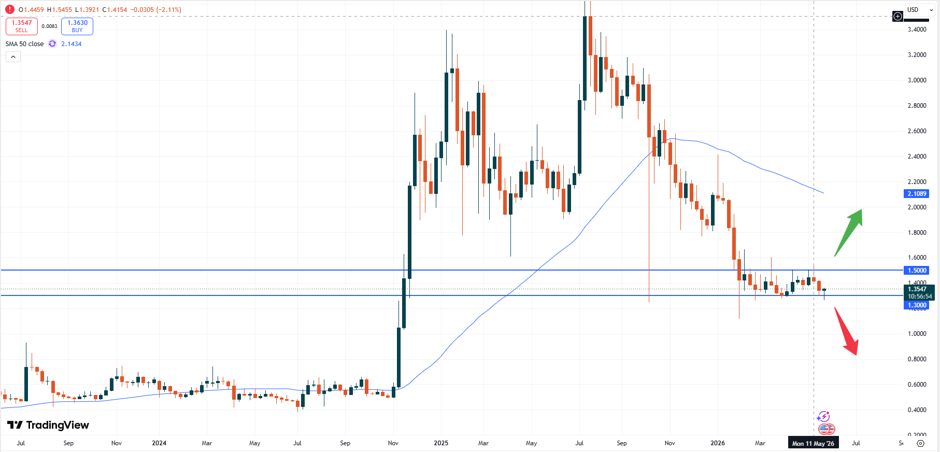
– XRP: XRP is currently trading at USD 1.3547. While the market ended the month of May on top of an important support level, prices might also continue to slide in the future.
XRPUSD, weekly chart
However, the price first needs to break the support zone at USD 1.3000 in order to remain in the downtrend. A recovery above the psychological USD 1.5000 price tag might also indicate that Ripple will push higher again. The upside then remains open until USD 2.000.
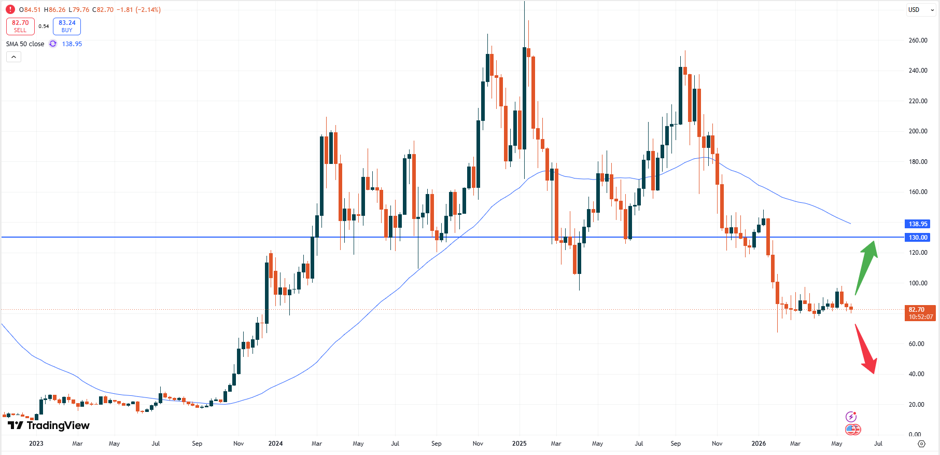
– SOL: Solana is currently trading at USD 82.70. The bearish sentiment of this token remains persistent, with Solana potentially sliding lower. If the USD 80.00 level will give way, the prie might slide further.
SOLUSD, weekly chart
However, the upside might also start to gear up some momentum, especially during the early days in the month of June. A rise above USD 100.00 would then indicate that the market might also rise further.
Vantage does not represent or warrant that the material provided here is accurate, current, or complete, and therefore should not be relied upon as such. The information provided here, whether from a third party or not, is not to be considered as a recommendation; or an offer to buy or sell; or the solicitation of an offer to buy or sell any financial instruments; or to participate in any specific trading strategy. Any research provided does not have regard to the specific investment objectives, financial situation and needs of any specific person who may receive it. We advise any readers of this content to seek their own advice. Without the approval of Vantage, reproduction or redistribution of this information is not permitted.